Lesson plans

What’s in a Pasifika name? Constructing a name dataset
The lesson introduces Year 9 students to constructing variables and designing survey questions for categorical data through the context of their names. In a teacher‐supported lesson students are encouraged to consider characteristics of names to form variables in preparation for designing survey questions, followed by data collection, and interpreting the resultant datasets. The activity engages students in the first three phases of the PPDAC cycle.
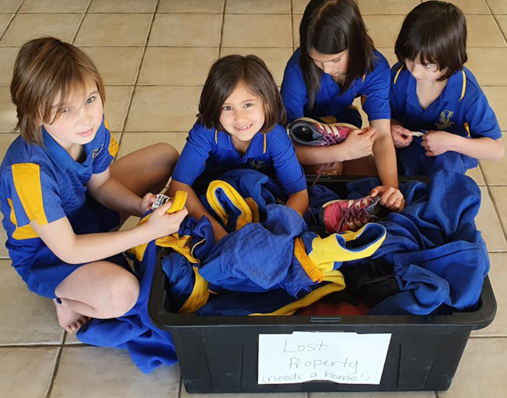
Lost property
This lesson introduces Year 1 students to exploring, graphing, and interpreting categorical data through the context of lost property in their school. In a teacher-supported lesson, students are encouraged to organise and learn from physical data, to transition to icon bar graphs and to engage in the entire PPDAC cycle.
Experiencing experimental design principles: The Elevens trick
In this lesson students experience an experiment first-hand. Students then reflect on experimental design principles in evaluating the experiment. The experiment is conducted as a comparison of two independent groups.

Laying the foundations for the randomisation test
This lesson can be taught in two sessions to Year 13 statistics students or in one or two lectures to stage one statistics students. The lesson introduces four key ideas that underpin the randomisation test: the meaning of unusualness; chance acting alone behaviour; the omnipresence of chance; and evidence and argumentation. Students participate throughout the lesson with a mixture of hands-on and online interactions.

Using video clips to kick‐start statistical thinking – research questions and study design
This lesson plan provides guidance and advice on how to integrate video clips into lectures to help facilitate the development of statistical thinking in students. Although the lesson can be applied in multiple ways, it looks specifically at nurturing students’ skills in developing good research questions applicable to a statistical investigation.
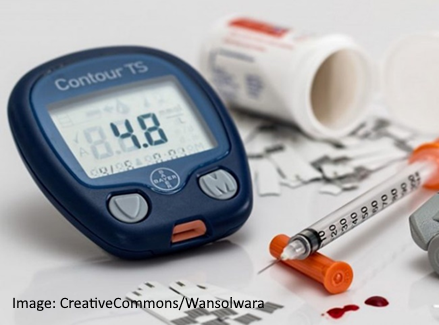
Using the Pachinkogram to introduce and explore Bayes’ theorem
A person has been randomly chosen to be tested for diabetes and tests positive. What is the probability they actually have diabetes? Students use the Pachinkogram visual tool to explore this scenario and investigate what happens when the given probabilities change. Rather than introducing Bayes’ theorem using formulae, this lesson aims to give students an intuitive understanding of the nature and effect of given and resultant probabilities.

Is the wonky dice fair?
In this activity, students explore the actual and expected outcomes of a six-sided “wonky” dice. Students use what they have learned about sampling variation to decide if there is any reason to think their wonky dice might not be fair.

Probability explorations in a game context: The dice difference game
Learning about probability poses difficulties for students at all levels. In this lesson students are asked to make predictions about the fairness of a dice difference game and then test them by gathering and examining data. Student predictions and conclusions are examined and re-examined in interactions among small group members and whole class or group and teacher. This lesson also addresses some common misconceptions relating to probability of simple and compound events.

What pets do the kids in our class have?
This lesson introduces multivariate whole number data cards for year 3-6 students through the context of pets. The use of the data cards is designed to move students away from collecting single variable data in tables with tally marks to collecting multivariate data to allow for a wider view of their investigative question. The data cards encourage multiple displays of the data as the students notice patterns in the data. This lesson allows students to engage in the entire PPDAC cycle.

The North Island has the bigger population, but does the South Island have the bigger motor vehicle engines? An introduction to bootstrapping
The lessons introduce the concept of resampling through bootstrapping, leading to the formation of a confidence interval of the difference between two means or two medians. The students experience sampling variation and bootstrapping visually through the aid of technology and manually through a physical exercise involving data cards of a sample from a very large population. A confidence interval of the difference between two population parameters is formed and interpreted. Lastly the experience using technology is formalised.